But I've got something more interesting to talk about.
Toronto programmer James Fisher was wondering what can be done with all the data the City of Toronto publishes. Through its open data initiative, anyone can get an astronomical amount about our public services.
Fisher took data from the buses and streetcars serving the city for six hours one Friday morning.
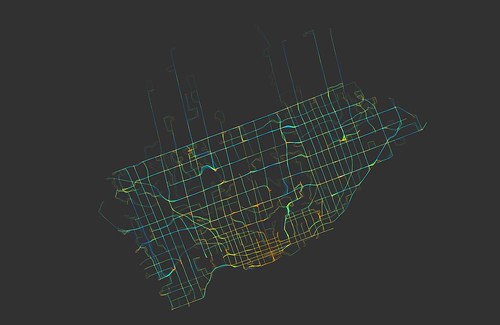 |
| An capture of six hours of TTC buses and streetcars. Courtesy of James Fisher himself, found on Flickr as indexity. |
It's worth having a watch. It's interesting and even enchanting to have a look as the city awakes.
But the most important part, for me, is that routes are colour-coded by speed. You can see which ones are moving slower, and even which areas are underserved.
This is the kind of project I'm hoping to take on. I'm in touch with TTC communications, and I'm hoping to visualize some of the delays on a map by colour-coding them. This way we can tell which areas suffer the most delays and which routes are the worst to take.
Fisher's project attracted some media attention, though this isn't his first time visualizing TTC data.
Seven months ago, Fisher took a day of streetcar traffic and made it into a 90-second video. The dots are coloured by route, not speed, and there's something magical about it. Have a look:
TTC Streetcars from James Fisher on Vimeo.
No comments:
Post a Comment